


Data Architecture — Exploring the Interior Walls of Modern Data Platforms: Episode I (Fabric Case Study).
Drawing Inspiration from Seattle’s Skyline: Warehouses, Lakehouses, and the Medallion Architecture.


Prologue
It’s 5:37 a.m., and I'm jogging through Arbor Heights in Seattle. It’s the holiday season, and I'm surrounded by architectural diversity—townhouses, detached houses, condominiums, coffee shops, and stunning modern homes. In some areas, the remnants of demolished structures starkly contrast with those awaiting renovation and revival.
After my run, under the cold stream of a morning shower — where the best ideas often surface — I began to visualize the buildings I had just passed.
As a developer, I began to ask myself; What’s the thought process behind the exteriors and interiors of these buildings? How do architects decide on layouts, dimensions, or the perfect colour schemes? What are the fundamental building blocks that bring these homes to life? And how are they masterfully assembled into architectural landmarks that add beauty and grandeur to Seattle’s cityscape?
On my walk back to my Airbnb, I imagined the creative minds of architects as they conceptualized these remarkable structures. “Skyscrapers demand meticulous engineering to stand tall, and data architecture allows organizations to rise above the competition. I drew the parallels in my head.”
Let’s dive into the data architecture used by data-driven companies.
NB: Every organization’s data platform is unique, and the ideas I share below are meant to inspire, not dictate, how you should build yours.

The Blueprint
The Blueprint—When I was younger, my mentor shared advice that became a cornerstone of my data journey: “To navigate life, you need a mental model — a framework to tackle challenges with clarity and purpose. Remember, you’re here to love, help those in need, and solve complex problems.”
As cliché as it may sound, he emphasized that every success starts with a well-thought-out plan and a passion for what you do. This combination of vision and purpose propels us forward in life and work.
Standing in awe of Seattle’s skyscrapers, I saw past their gleaming facades to the intricate interiors — walls, foundations, and structures working in harmony. Similarly, modern data platforms are not just collections of reports, databases and pipelines; they are ecosystems built on solid cloud infrastructure, protected by governance, and driven by dynamic data flows.
Architecture, whether of steel or data, begins with a vision — a blueprint of what could be. Seattle’s skyline, a blend of tradition and modernity, mirrors the dual nature of today’s data platforms: balancing legacy systems with cutting-edge technologies.
Design Thinking
Design Thinking—After my morning run, I reflected on how architects design homes for both beauty and purpose, anticipating the needs of those who will live within. Similarly, data architects design platforms that store data and transform it into actionable insights. Each blueprint begins with a question: How do we create something structurally sound, provide value to customers, be durable, and be scalable?
In Seattle, every building shapes the skyline; likewise, data architects mould raw data into strategic value, combining technical expertise with creative problem-solving. An excellent data architecture doesn’t just function; it empowers, elevating an organization’s innovation ability.
Data Architecture
Like urban architecture, data architecture is the foundation of modern organizations. It defines how data is collected, stored, and utilized, aligning strategies with business objectives to drive insights and competitive advantage.
Consider companies like Netflix, whose recommendation algorithms, and streaming platforms are powered by robust data architecture which serves millions of customers. Managing billions of data points in real time requires precision, scalability, and reliability.
I thought to myself: “How can the principles of modern building design inspire the creation of robust, scalable, and secure data platforms? Surely, there’s a connection waiting to be uncovered.”
After brainstorming on my notepad at my airbnb this is what I came up with, let’s begin our story.
Introduction
In today’s fast-paced digital era, the transformative power of big data technologies is reshaping industries. The advent of modern cloud platforms, distributed computing, and massively parallel processing (MPP) architectures has set new benchmarks for managing and leveraging data at scale.
With cutting-edge tools like Fabric Warehouse, AWS Redshift, Snowflake, Google Big Table, Databricks, DBT, and Synapse Analytics, businesses can unlock actionable insights with unparalleled speed and precision.
This intricate ecosystem — powered by cloud giants like Azure, AWS, and GCP — thrives on the collaboration between stakeholders, solution architects, data architects and engineers. Architects design the strategic blueprints, while engineers execute them with precision and innovation based on the requirements, constructing resilient architectures that fuel growth and drive transformation in a data-driven world.
Five must-have layers of a modern data platform
A well-designed data platform is like a meticulously planned building, with each layer serving a specific purpose to ensure stability, functionality, and adaptability. Here, we explore the five critical layers that form the foundation of a robust, scalable, and reliable data platform.
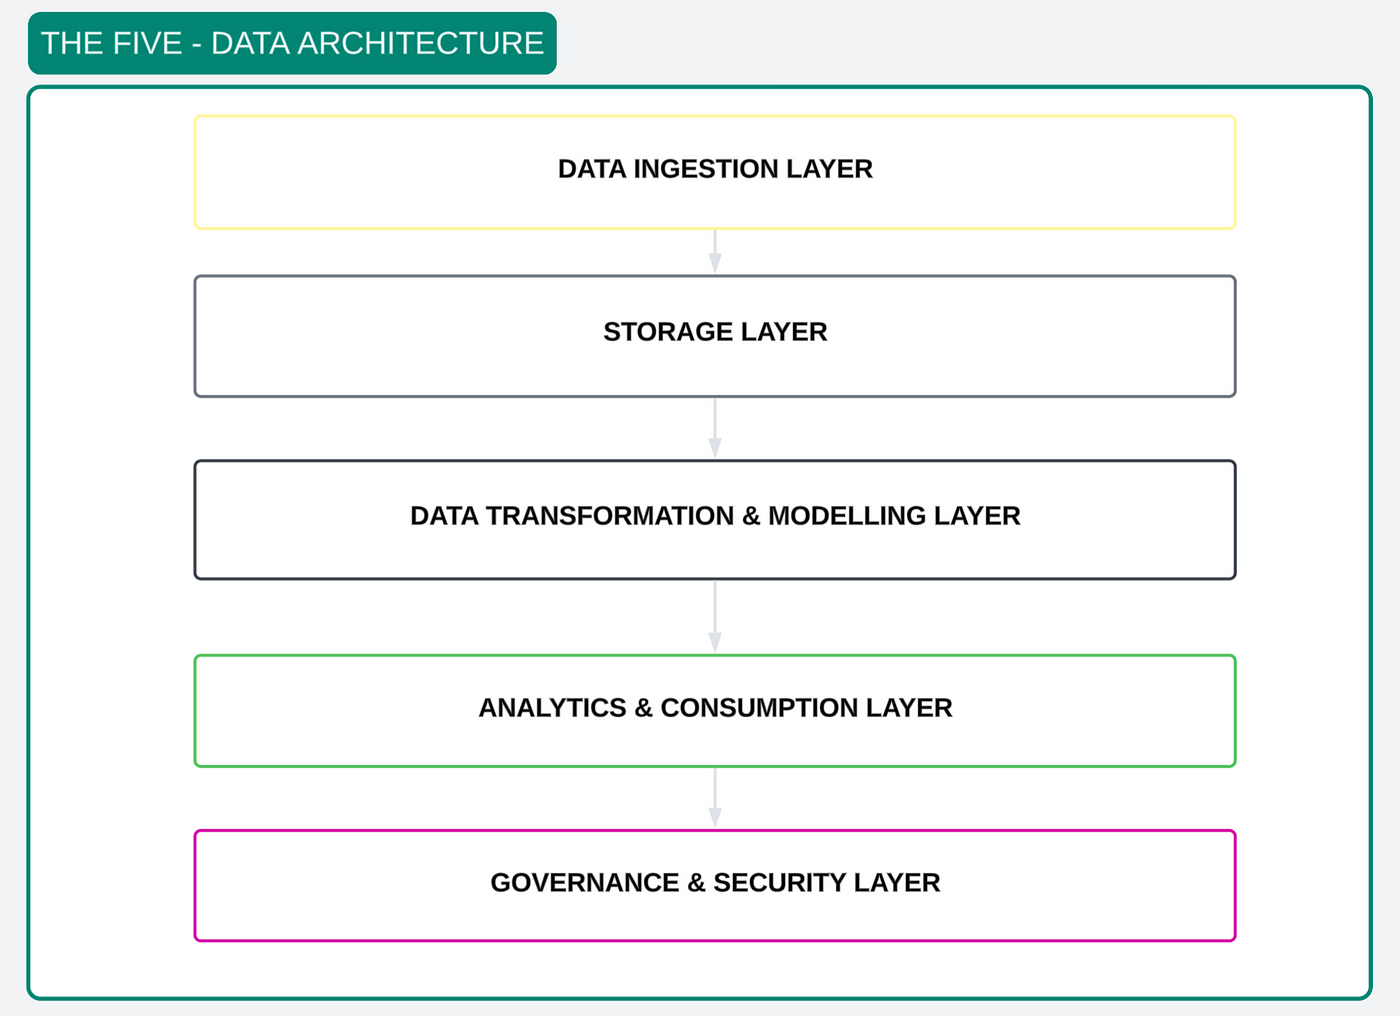
Data Storage and Processing- The foundation of any data platform lies in its storage and processing capabilities.
Whether it’s a data warehouse, data lake, or a hybrid lakehouse, this layer ensures scalable, secure, and long-term storage for structured and unstructured data, ready for analysis when needed.
Data Ingestion—The platform's lifeblood, ingestion pipelines, bring data from diverse sources into the system. This process, often associated with ETL or ELT, handles the complexities of structured and unstructured data, ensuring seamless movement across systems.
Data Transformation and Modeling — Turning raw data into refined insights starts here. Transformation cleanses and enriches data for analysis, while modelling organizes it into structures that support intuitive querying and reporting, creating a blueprint for actionable insights.
Business Intelligence (BI) and Analytics — Where data comes to life. BI tools and dashboards transform processed data into accessible, visual insights, enabling end-users to make informed decisions. Without this layer, data remains static and underutilized.
Data Observability — As data ecosystems grow, reliability and trustworthiness are paramount. Observability tools monitor data freshness, accuracy, and lineage, eliminating downtime and ensuring data flows seamlessly through the pipeline.
Each layer is indispensable, working in harmony to build a robust, scalable, and intelligent data platform.
Let’s dive deeper!
Chapter 1 — The Foundation: Base of All Structures.
The Base — A house built on a shaky foundation is destined to collapse. Similarly, in data architecture, the storage layer is the bedrock upon which the entire platform is built. Ensuring this layer is scalable, durable, and resilient is critical when storing petabytes of historical and transactional data over time.
Stability and Resilience
Like a building architect accounts for earthquakes, storms, or wear and tear, a data architect must design for resilience. Fault tolerance, disaster recovery, and security are the essential pillars of this foundation. Data architects must consider factors such as data redundancy, replication, and encryption to ensure the platform withstands unexpected failures while maintaining performance and security.
Choosing the Right Base
The data storage layer is central to any modern analytics ecosystem, serving as the repository where data resides before becoming actionable insights.
Selecting the right storage solution depends on the 3 Vs of Big Data: Volume (scale of data), Velocity (speed of data ingestion), and Variety (structured, semi-structured, or unstructured data). The choice often narrows down to data warehouses and data lakehouses, each tailored for specific needs.

Warehouses: Structured and Optimized
Data warehouses are centralized systems designed for structured data storage and complex analytical processing. These systems excel at enabling high-performance queries and powering machine learning models and reporting dashboards.
Why Warehouses? They are the go-to solution for structured data and historical analysis. They provide query optimization, metadata management, and advanced analytics capabilities.

Fabric Warehouse: Powered by Synapse Analytics, this modern warehouse blends the flexibility of the cloud with traditional analytics capabilities. It supports advanced querying and reporting, providing businesses with a scalable and efficient platform for structured and semi-structured data.
Lakehouses: The Best of Both Worlds!
The data lakehouse combines the flexibility of data lakes with the structured approach of data warehouses. It allows organizations to store diverse data formats, maintain ACID properties (atomicity, consistency, isolation, durability), and handle workloads like machine learning, reporting, and real-time analytics.
• Why Lakehouses? They offer scalable storage for unstructured and semi-structured data while enabling analytics and governance.
Microsoft Fabric Lakehouse: Built on OneLake and powered by Apache Spark and SQL engines, Fabric Lakehouse bridges the gap between traditional lakes and warehouses. It supports ACID transactions with Delta tables and provides unified storage for diverse analytical workloads.
NYC Taxi Mini Case Study I: Project Implementation.
In the bustling streets of New York City, millions of taxi rides generate a wealth of data every day. Capturing, processing, and analyzing this data can reveal invaluable insights into urban mobility, passenger behaviour, and operational efficiency.

Project Objective
This mini case study takes you through the implementation of a simple fabric data pipeline, transforming raw trip data into actionable intelligence.
I will write about data pipelines in Episode 2 of this Data Architecture series.

One of my favourite features in Microsoft Fabric is the combination of shortcuts to external sources and the SQL Analytics Endpoint — a duo that exemplifies both simplicity and power. These features eliminate the need for data duplication, offering a seamless, read-only way to query external tables while maintaining a unified data environment.
Microsoft — “The SQL Analytics Endpoint is particularly brilliant in its ability to bridge the gap between lakehouse storage and structured querying. Every Fabric Lakehouse comes with an autogenerated SQL Analytics Endpoint, allowing users to switch effortlessly between a data engineering-focused lake view (optimized for Apache Spark) and a relational SQL view. This dual approach supports data transformations, SQL-based security, object-level permissions, and the creation of views, functions, and stored procedures — all while ensuring high accessibility and data integrity.”
It’s a simple yet elegant solution that enhances usability without compromising efficiency.

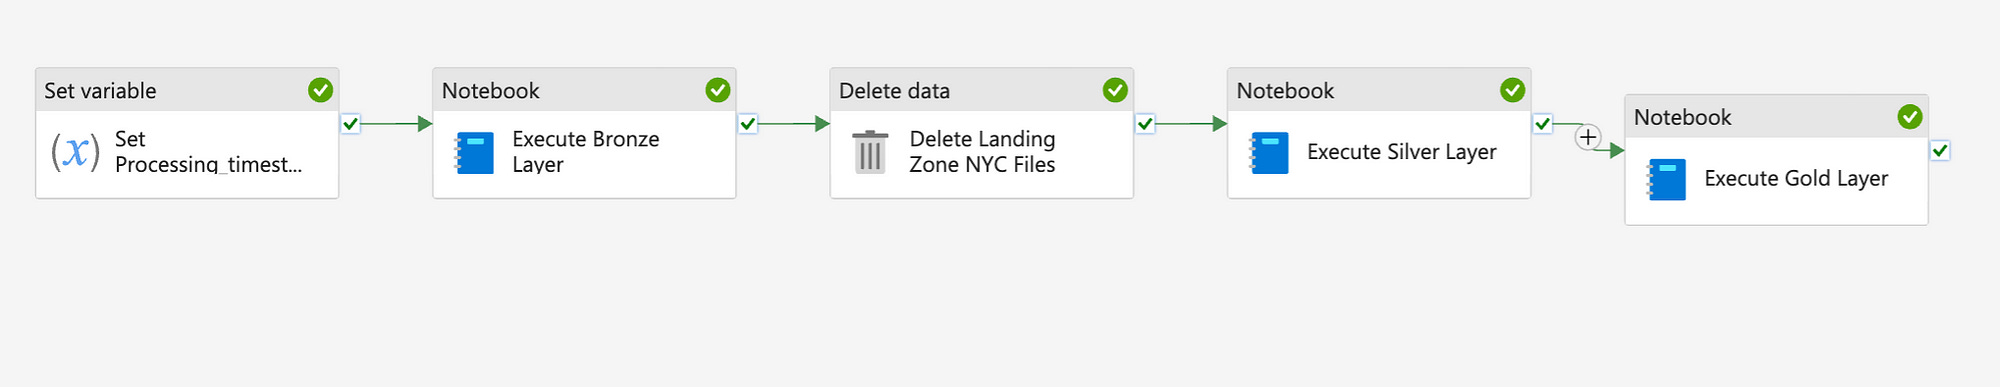
The code below showcases the end-to-end implementation of our Data Zones using Python notebooks, which were invoked by Fabric Data factory pipelines in the screenshot below.
With Fabric Data Factory pipelines, executing each zone in the Medallion Architecture becomes seamless. These pipelines allow us to efficiently process datasets across the Bronze, Silver, and Gold layers, ensuring smooth transitions and streamlined data workflows at every stage.
# Importing libraries
from pyspark.sql.functions import to_timestamp, lit, expr, date_format, col

# Parameters
processing_timestamp = ""

# Step 1: Load raw parquet data into Bronze layer
bronze_path = "Files/fabric/demo/landing-zone/yellow_tripdata/*"
bronze_table = "Nyc_bronze.nyc_taxi_yellow"

df_bronze = (
    spark.read.format("parquet")
    .load(bronze_path)
    .withColumn("processing_timestamp", to_timestamp(lit(processing_timestamp)))
)

# Save raw data to Bronze table
df_bronze.write.mode("append").saveAsTable(bronze_table)

# Step 2: Transform data from Bronze to Silver layer
silver_table = "Nyc_silver.nyc_taxi_yellow"

df_silver = (
    spark.read.table(bronze_table)
    .filter(f"processing_timestamp = '{processing_timestamp}'")
    .withColumn(
        "vendor",
        expr(
            """
            CASE
                WHEN VendorID = 1 THEN 'Creative Mobile Technologies'
                WHEN VendorID = 2 THEN 'VeriFone'
                ELSE 'Unknown'
            END
            """
        ),
    )
    .withColumn(
        "payment_method",
        expr(
            """
            CASE
                WHEN payment_type = 1 THEN 'Credit Card'
                WHEN payment_type = 2 THEN 'Cash'
                WHEN payment_type = 3 THEN 'No Charge'
                WHEN payment_type = 4 THEN 'Dispute'
                WHEN payment_type = 5 THEN 'Unknown'
                WHEN payment_type = 6 THEN 'Voided Trip'
                ELSE 'Unknown'
            END
            """
        ),
    )
    .select(
        "vendor",
        "tpep_pickup_datetime",
        "tpep_dropoff_datetime",
        "passenger_count",
        "trip_distance",
        col("RatecodeID").alias("ratecode_id"),
        "store_and_fwd_flag",
        col("PULocationID").alias("pu_location_id"),
        col("DOLocationID").alias("do_location_id"),
        "payment_method",
        "fare_amount",
        "extra",
        "mta_tax",
        "tip_amount",
        "tolls_amount",
        "improvement_surcharge",
        "total_amount",
        "congestion_surcharge",
        col("Airport_fee").alias("airport_fee"),
        "processing_timestamp",
    )
)

# Save transformed data to Silver table
df_silver.write.mode("append").saveAsTable(silver_table)
# Step 3: Enrich data and save to Gold layer
gold_table = "Nyc_gold.nyc_taxi_yellow"
lookup_table = "Nyc_silver.taxi_zone_lookup"

df_pu_lookup = spark.read.table(lookup_table)
df_do_lookup = spark.read.table(lookup_table)

df_gold = (
    spark.read.table(silver_table)
    .filter(f"processing_timestamp = '{processing_timestamp}'")
    .join(df_pu_lookup, col("pu_location_id") == df_pu_lookup["LocationID"], "left")
    .join(df_do_lookup, col("do_location_id") == df_do_lookup["LocationID"], "left")
    .select(
        "vendor",
        date_format("tpep_pickup_datetime", "yyyy-MM-dd").alias("pickup_date"),
        date_format("tpep_dropoff_datetime", "yyyy-MM-dd").alias("dropoff_date"),
        df_pu_lookup["Borough"].alias("pickup_borough"),
        df_do_lookup["Borough"].alias("dropoff_borough"),
        df_pu_lookup["Zone"].alias("pickup_zone"),
        df_do_lookup["Zone"].alias("dropoff_zone"),
        "payment_method",
        "passenger_count",
        "trip_distance",
        "tip_amount",
        "total_amount",
        "processing_timestamp",
    )
)

# Save enriched data to Gold table
df_gold.write.mode("append").saveAsTable(gold_table)
NB: Processing_timestamp is being passed as a parameter within my pipeline at runtime. I utilized the taxi zone lookup table for more context.
Gold Table
The execution of our notebooks culminates in the creation of the final Gold table, as shown below. This table serves as a ready-to-use dataset, optimized for direct integration with tools like Power BI for advanced analysis and visualization. In our next episode, I’ll dive into the visuals and insights derived from this table.

Choosing the Right Foundation
Just as an architect carefully chooses between a concrete or steel foundation based on the building’s purpose, a data architect must decide between a data warehouse and a lakehouse.
• Warehouses: Ideal for businesses prioritizing structured data, historical analysis, and reporting.
• Lakehouses: Perfect for organizations needing flexibility with diverse data formats, real-time processing, and AI/ML integration.
NB: The choice of storage impacts scalability, adaptability, and long-term viability.
Building for Tomorrow
The storage layer isn’t just about where data resides — it’s about how the entire platform scales, evolves and meets future demands. Foundational decisions today, such as adopting lakehouse architecture or enhancing warehouse capabilities, shape an organization’s ability to extract value and maintain agility in a data-driven world.
Just like Seattle’s iconic buildings rest on well-engineered foundations, your data platform’s success starts at the base.
Chapter 2 — Aesthetic Design, User-Centric Data Models & Zones.
In architecture, design defines usability, much like data modelling shapes the user experience in analytics. Interior walls structure how we interact with a space; data models organize how we interact with data. The goal is to strike a balance between structure and adaptability, ensuring seamless navigation and usability while planning for future needs.
OLTP Vs OLAP
Imagine walking through the architectural marvels of Seattle, like the iconic Space Needle and the modern Amazon Spheres. Each represents a different kind of data system:
• OLTP (Online Transaction Processing): Think of a bustling marketplace like Pike Place Market — dynamic, real-time, and focused on small, frequent transactions. OLTP systems are designed for handling day-to-day operations, such as processing orders, inventory updates, and customer interactions. They prioritize speed, accuracy, and concurrency.
• OLAP (Online Analytical Processing): Now picture the Seattle Central Library — a place for deep study, analysis, and insights. OLAP systems are built for querying large volumes of historical data to support decision-making. They focus on complex calculations, aggregations, and multidimensional views of data.
In essence, OLTP is the engine for daily business operations, while OLAP is the observatory for understanding trends and patterns over time. Both are critical, like the balance of form and function in Seattle’s iconic buildings.
Dimensional Modeling
Kimball methodologies bring elegance to data warehousing, focusing on user-friendly querying and analytics. At its core, dimensional modelling revolves around two key components: Fact Tables (store numeric measures), enabling aggregation & analysis, and Dimension Tables (provide context to facts, such as customer demographics or product categories.
Star Vs Snowflake Schemas
Star Schema: Picture the Space Needle as the central hub, surrounded by smaller attractions like the Chihuly Garden and the Museum of Pop Culture. In a Star Schema, the fact table sits at the center, connecting directly to dimension tables. It’s simple, flat, and optimized for query performance, much like a well-planned tourist route.

Snowflake Schema: Now envision the intricate design of the Amazon Spheres, where the structure branches out into interconnected layers. In a Snowflake Schema, dimensions are normalized into multiple related tables, creating a more complex yet detailed design. This structure minimizes redundancy but can increase query complexity.

Both schemas aim to organize data, but the Star Schema prioritizes simplicity and speed, while the Snowflake Schema emphasizes detail and normalization, just like Seattle’s architecture, balancing iconic simplicity with modern intricacy.
i-SkyFlightsAnalytics Mini Case Study II: Project Implementation.
In this chapter of our story, SomeRandomCompany, a prominent data broker and collection firm based in California, has acquired i-SkyFlightsAnalytics to scale their in-house data farm, adding aviation to their expanding Sports & Entertainment portfolio.

Project Objective
The goal? To access a rich repository of global airline data that can be leveraged for targeted recommendations and advanced analytics.

With access to their operational systems, we begin with the Entity-Relationship Diagram (ERD) above, a representation of their transactional database. However, OLTP systems are optimized for operational systems, not for the analytical workloads required for business insights. To meet the reporting and analytical needs, we translate this into a Dimensional Model designed for efficient querying and reporting.
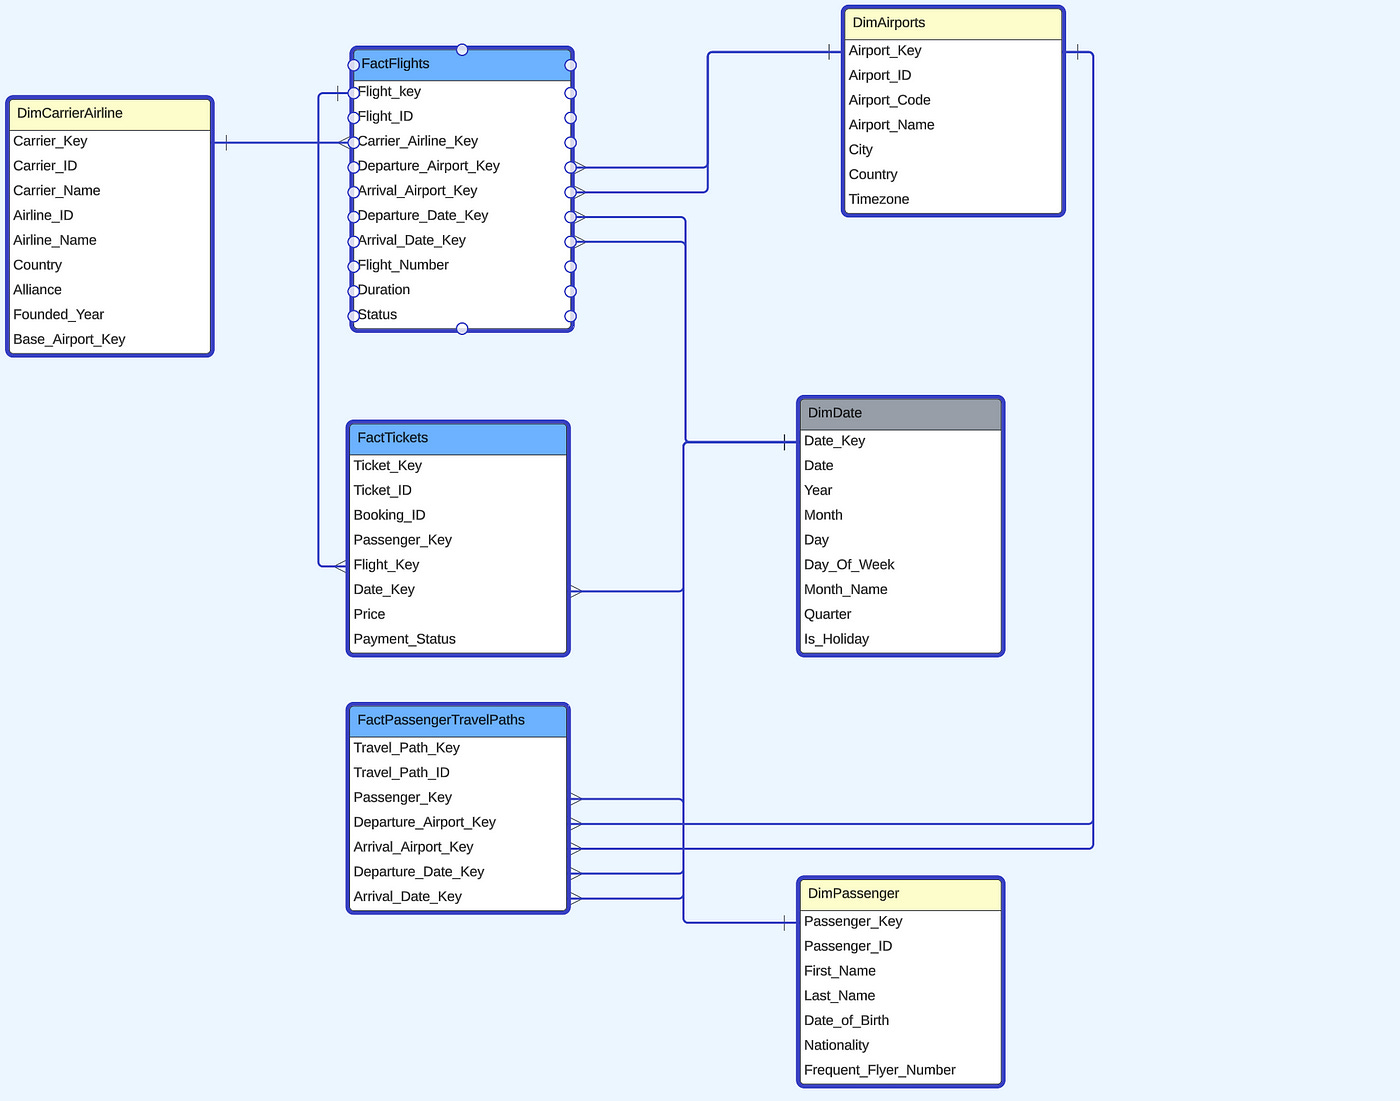
Incorporating Dimensional Design for the Project.
Above is the Dimensional Model, a streamlined version of the ERD designed for efficient data analysis. After exploring and denormalizing the data while aligning with our fictional stakeholders & data analyst, this model answers critical analytical questions, such as:
1. Flights: How many flights operated this month? What are the average delays or durations by airline or route?
2. Passengers: Which passengers flew the most? What routes are popular among frequent flyers or specific nationalities?
3. Airports: Which airports are busiest? How does on-time performance vary by departure or arrival location?
4. Bookings & Tickets: What’s the total revenue per route, carrier, or period? How do booking patterns shift by season or holidays?
By applying the Kimball Dimensional Approach, I reimagined the data platform’s structure with a design that balances functionality and elegance, much like the interior layout of a modern building.
• I identified Flights as the central fact table, capturing key operational metrics such as flight durations, delays, and counts.
• I recognized Tickets as another critical fact table, focusing on financial metrics like ticket prices and total revenue.
• Supporting dimensions were defined to provide contextual attributes: Airline, Carrier, Airport, Passenger, and Date, enabling business users to slice and dice data intuitively.
• For more complex scenarios — like analyzing Passenger Travel Paths — I introduced a factless fact table to capture journey patterns and interactions without traditional numeric measures.
The goal is to uncover insights into flight operations, passenger behaviour, and revenue trends. From here, we identify fact tables (e.g., Flights, Bookings) and dimensions (e.g., Passengers, Airports) to design a data model that supports these business questions seamlessly.
Why Dimensional Modeling, You May Ask?
Dimensional modelling simplifies data by organizing it into intuitive structures, making querying faster and more accessible for business users. For instance, dimensions like “DimCarrierAirline” and “DimAirport” allow users to easily group, filter, and drill into specific datasets, unlocking actionable insights with minimal complexity. We then captured operational and financial metrics in the Fact Tables.
Key benefits:
• User-Friendly: Business logic and analytics become more accessible, as data is organized by familiar entities.
• Performance: Joins typically happen between a fact and its dimensions, which are straightforward and fast.
Scalability: Adding new facts or dimensions is relatively easy, maintaining a consistent approach.
Steps I Used to Create the Dimensional Model above:
1. Define the Business Process: Determine the analytical purpose (e.g., flight analysis).
2. Declare the Grain: Specify the level of detail for the data (e.g., one row per flight).
3. Identify Dimensions: Outline descriptive attributes (e.g., Region, Airline, and Date).
4. Identify Facts: Highlight measurable attributes (e.g., revenue, passengers, and delays).
This remodelling serves as the “interior design” of the data platform. Just as a well-designed floor plan reduces clutter and enhances usability, the dimensional model simplifies query performance, reduces complexity, and creates an intuitive user experience for analytics. It enables decision-makers to navigate the data seamlessly — answering questions, uncovering insights, and building value for the organization.
Medallion Architecture: Case Study III
As I have showcased above, think of the Medallion Architecture as a well-zoned house: each area serves a purpose, yet they work harmoniously to create a livable space. NB: For the Spotify Case Study, check it out here.
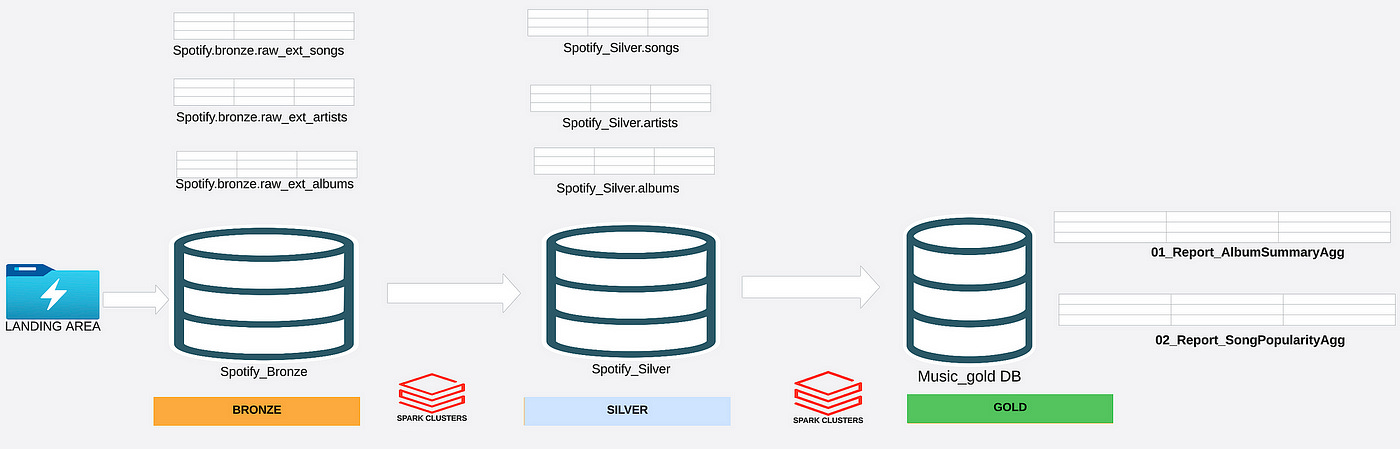
Bronze Layer (Raw Zone) — Like a storage room holding unfiltered materials, the Bronze Layer stores raw, unprocessed data directly from source systems. This layer ensures historical and archival integrity, maintaining data in its original form for audits and compliance.
Silver Layer (Refined Zone) — This is where the raw materials are cleaned, refined, and organized — much like a living room designed for functionality and coherence. Here, duplicate records are eliminated, data is harmonized, and schemas are enforced to ensure usability.
Gold Layer (Business-Ready Zone) — The polished product: highly curated datasets tailored for analytics and reporting. Think of it as the master bedroom — a space designed with user comfort and purpose in mind. Pre-aggregated or denormalized tables enable decision-makers to gain quick insights without taxing the system.
Each layer contributes to the transformation of raw data into actionable insights, ensuring scalability, accuracy, and efficiency.
One Big Table: Simplicity or Chaos?
While dimensional modelling and medallion architecture focus on organization, the “One Big Table” approach takes the opposite route — consolidating all data into a single, massive table.

Advantages:
• Simplicity: Easier to query since all data is in one place.
• Speed: Reduces the need for complex joins, speeding up queries for smaller datasets.
• Flexibility: Enables rapid prototyping by allowing users to mix and match data.
Drawbacks:
• Scalability: As the table grows, queries may become slower. -_-
• Complexity: Lack of structure can make it challenging to manage relationships or maintain data integrity.
• Governance: Harder to enforce rules or track data lineage.
In my opinion, while the “One Big Table” is tempting for its simplicity, it often falls short of large-scale enterprise needs. It’s akin to stuffing all your belongings into one room — fine for quick access but unsustainable for long-term organization.
In summary, whether it’s Kimball’s elegant dimensional models, the layered Medallion Architecture, or even a unified table, the foundation of any data platform lies in its design. Thoughtfully structured models make data accessible, actionable, and future-ready, just as intuitive interiors make spaces livable.
Conclusion
Sitting at the coffee shop, watching the hustle and bustle of this new city, I reflect on how everything around me — from the intricate designs of the buildings to the invisible systems powering them — embodies timeless architectural principles: form, function, and adaptability.
The same holds for data platforms. The best architectures are those that blend art, science, and utility seamlessly, designed not just for today but to evolve with purpose over time. They’re invisible in their reliability but unforgettable in their impact.
Epilogue
In the next part of our story, we’ll explore the critical pillars of Data Loading — Batch / Streaming Pipelines the cornerstones of any modern data platform in Episode II. These are the final strokes in designing platforms that not only meet today’s demands but also stand resilient for the future.
Like the skyline of this vibrant city, the ultimate goal is balance — a structure that stands as a testament to innovation, strength, and timelessness.
Stay tuned !!
Thank you for reading!
List of Inspirations
https://www.montecarlodata.com/blog-what-is-a-data-platform-and-how-to-build-one/
https://3cloudsolutions.com/resources/the-importance-of-a-modern-data-platform/
https://www.goodreads.com/book/show/44245196-the-great-mental-models
https://www.sqlservercentral.com/articles/thread-04-data-engineering-with-fabric
Socials
Join me on LinkedIn -Patrick B.O
Patrick B. Okare serves as the Solutions Data Architect / Lead Data Engineer at KareTech Analytics, he specializes in steering transformative cross-regional data analytics initiatives spanning diverse industries. With a focus on data integration, engineering and data management, he operates alongside a team of forward-thinking technologists and domain experts. Together, we expedite the achievement of impactful business results for clients, partners, and the broader community.